Monitoring power draw with WeMo Insight Switches
Published on

A WeMo Insight Switch
I recently picked up a couple of Belkin’s WeMo Insight Switches to monitor power usage for my PC and networking equipment. WeMo is Belkin’s home automation brand, and the switches allow you to toggle power on and off with an app, and monitor power usage.
The WeMo Android app is pretty dismal. It’s slow, doesn’t look great, and crashed about a dozen times during the setup process for each of my two switches. It also doesn’t provide much information at all about power: you can see average power draw and current power draw, and that’s basically it.
Belkin has provided an option to e-mail yourself a spreadsheet with historical power data, and can even do it on a regularly scheduled basis, but that’s not really a nice solution if you want up-to-date power stats. Even if you were happy with data arriving in batch, having to get hold of an e-mail attachment and parse out a weirdly formatted spreadsheet doesn’t make for easy automation. It also relies on Belkin supporting the service indefinitely, which isn’t necessarily going to happen.
Enter the SOAP API
Fortunately, the devices themselves expose an API to get the data. Once a switch is setup with the WeMo app, it connects to a WiFi network. You can discover WeMo devices on the network using a UPnP broadcast, and then from there a list of supported services. Each service has a number of SOAP actions, with nice obvious names, and parameters documented in the XML service description.
For the insight switches, there’s a service at /upnp/control/insight1 which has a number of
actions including GetPower and GetTodayKWH. Sending a SOAP request isn’t too difficult
(albeit nowhere near as nice as a REST JSON API) — here’s a sample request I made using
the DHC chrome extension:
POST /upnp/control/insight1 HTTP/1.1
Accept: */*
Accept-Encoding: gzip, deflate
Accept-Language: en-GB,en;q=0.8
Content-Type: text/xml
Origin: chrome-extension://aejoelaoggembcahagimdiliamlcdmfm
SOAPACTION: "urn:Belkin:service:insight:1#GetPower"
User-Agent: Mozilla/5.0 (Windows NT 10.0; Win64; x64) AppleWebKit/537.36 (KHTML, like Gecko) Chrome/51.0.2704.29 Safari/537.36

<s:Envelope xmlns:s="http://schemas.xmlsoap.org/soap/envelope/" s:encodingStyle="http://schemas.xmlsoap.org/soap/encoding/">
    <s:Body>
        <u:GetPower xmlns:u="urn:Belkin:service:insight:1"/>
    </s:Body>
</s:Envelope>
The name of the action (in the SOAPACTION header) and the XML namespace in the body are both constructed from information in the service definition. The result that comes back is:
<s:Envelope xmlns:s="http://schemas.xmlsoap.org/soap/envelope/" s:encodingStyle="http://schemas.xmlsoap.org/soap/encoding/">
    <s:Body>
        <u:GetPowerResponse xmlns:u="urn:Belkin:service:insight:1">
            <InstantPower>92170</InstantPower>
        </u:GetPowerResponse>
    </s:Body>
</s:Envelope>
The current power draw in milliwatts is returned in the <InstantPower> argument.
Putting the data to work
So now we have a way to pull the current power draw, a nice thing to do would be to plot a graph of it to see the variation over time. This is the short of thing you’d expect to see in the Belkin app, but it’s sadly missing. After a bit of research I settled on the tried and true rrdtool to store data and generate graphs. I created a new database to store the values from the two switches:
rrdtool create power.rrd \
    --start now \
    --step 60 \
    DS:wemoComputer:GAUGE:120:U:U \
    DS:wemoNetworking:GAUGE:120:U:U \
    RRA:AVERAGE:0.5:1:1440 \
    RRA:AVERAGE:0.5:10:1008 \
    RRA:AVERAGE:0.5:30:1488 \
    RRA:AVERAGE:0.5:120:1488 \
    RRA:AVERAGE:0.5:360:1488 \
    RRA:AVERAGE:0.5:1440:36500
This creates a database file which expects values to be given every 60 seconds for two data series: ‘wemoComputer’ and ‘wemoNetworking’. These are gauge types (i.e., a value we read off a gauge, rather than a counter that keeps going up) with no minimum and maximum (‘U’).
It then defines a series of round-robin archives. Each of these stores a fixed number of entries, and the oldest is overwritten when they become full. The interesting arguments are the step count (second to last) and number of samples (last argument). The first one takes every sample and keeps 1,440 of them (i.e., a full day at 1-minute resolution); the last one has a step of 1,440 and keeps 36500 of them (i.e., 100 years at 1-day resolution). The use of RRAs ensures that rrdtool can retain enough data to create historical graphs, while providing a fixed, finite maximum file size. With sufficient RRA coverage you can graph most timescales and have data available at a reasonable resolution.
Next, I created a small python script to retrieve the power using SOAP:
#!/usr/bin/python3

import requests
from xml.etree import ElementTree

def get_power(ip_and_port):
    headers = {'Content-type': 'text/xml', 'SOAPACTION': '"urn:Belkin:service:insight:1#GetPower"'}
    payload = '''<s:Envelope xmlns:s="http://schemas.xmlsoap.org/soap/envelope/"
                             s:encodingStyle="http://schemas.xmlsoap.org/soap/encoding/">
                  <s:Body>
                   <u:GetPower xmlns:u="urn:Belkin:service:insight:1"/>
                  </s:Body>
                 </s:Envelope>'''
    r = requests.post("http://%s/upnp/control/insight1" % ip_and_port, headers=headers, data=payload)
    et = ElementTree.fromstring(r.text)
    return et.find('.//InstantPower').text
I then have a dictionary of IP addresses to data series names, and the script polls each one in
turn and then executes an rrdtool update query to add the items to the database. I have this
script running every minute via cron.
After leaving the script to run for a bit and gather data, it’s time to make some graphs. I use the following to create a graph with a background gradient:
rrdtool graph desk-1d.png \
        -o -X0 -w800 -h500 \
        -u 2000 -l 20 -r \
        DEF:raw=power.rrd:wemoComputer:AVERAGE \
        CDEF:power=raw,1000,/ \
        CDEF:powerz=power,2000,LT,power,2000,IF CDEF:powerzNoUnk=power,UN,0,powerz,IF AREA:powerzNoUnk#ff0000 \
        CDEF:powery=power,1500,LT,power,1500,IF CDEF:poweryNoUnk=power,UN,0,powery,IF AREA:poweryNoUnk#ff0000 \
        CDEF:powerx=power,1000,LT,power,1000,IF CDEF:powerxNoUnk=power,UN,0,powerx,IF AREA:powerxNoUnk#ff0000 \
        CDEF:powerw=power,900,LT,power,900,IF CDEF:powerwNoUnk=power,UN,0,powerw,IF AREA:powerwNoUnk#ff0000 \
        CDEF:powerv=power,800,LT,power,800,IF CDEF:powervNoUnk=power,UN,0,powerv,IF AREA:powervNoUnk#ff1b00 \
        CDEF:poweru=power,700,LT,power,700,IF CDEF:poweruNoUnk=power,UN,0,poweru,IF AREA:poweruNoUnk#ff4100 \
        CDEF:powert=power,600,LT,power,600,IF CDEF:powertNoUnk=power,UN,0,powert,IF AREA:powertNoUnk#ff6600 \
        CDEF:powers=power,400,LT,power,400,IF CDEF:powersNoUnk=power,UN,0,powers,IF AREA:powersNoUnk#ff8e00 \
        CDEF:powerr=power,200,LT,power,200,IF CDEF:powerrNoUnk=power,UN,0,powerr,IF AREA:powerrNoUnk#ffb500 \
        CDEF:powerq=power,180,LT,power,180,IF CDEF:powerqNoUnk=power,UN,0,powerq,IF AREA:powerqNoUnk#ffdb00 \
        CDEF:powerp=power,160,LT,power,160,IF CDEF:powerpNoUnk=power,UN,0,powerp,IF AREA:powerpNoUnk#fdff00 \
        CDEF:powero=power,140,LT,power,140,IF CDEF:poweroNoUnk=power,UN,0,powero,IF AREA:poweroNoUnk#d7ff00 \
        CDEF:powern=power,120,LT,power,120,IF CDEF:powernNoUnk=power,UN,0,powern,IF AREA:powernNoUnk#b0ff00 \
        CDEF:powerm=power,100,LT,power,100,IF CDEF:powermNoUnk=power,UN,0,powerm,IF AREA:powermNoUnk#8aff00 \
        CDEF:powerl=power,90,LT,power,90,IF CDEF:powerlNoUnk=power,UN,0,powerl,IF AREA:powerlNoUnk#65ff00 \
        CDEF:powerk=power,80,LT,power,80,IF CDEF:powerkNoUnk=power,UN,0,powerk,IF AREA:powerkNoUnk#3eff00 \
        CDEF:powerj=power,70,LT,power,70,IF CDEF:powerjNoUnk=power,UN,0,powerj,IF AREA:powerjNoUnk#17ff00 \
        CDEF:poweri=power,60,LT,power,60,IF CDEF:poweriNoUnk=power,UN,0,poweri,IF AREA:poweriNoUnk#00ff10 \
        CDEF:powerh=power,50,LT,power,50,IF CDEF:powerhNoUnk=power,UN,0,powerh,IF AREA:powerhNoUnk#00ff36 \
        CDEF:powerg=power,40,LT,power,40,IF CDEF:powergNoUnk=power,UN,0,powerg,IF AREA:powergNoUnk#00ff5c \
        CDEF:powerf=power,30,LT,power,30,IF CDEF:powerfNoUnk=power,UN,0,powerf,IF AREA:powerfNoUnk#00ff83 \
        CDEF:powere=power,20,LT,power,20,IF CDEF:powereNoUnk=power,UN,0,powere,IF AREA:powereNoUnk#00ffa8 \
        CDEF:powerd=power,0,LT,power,0,IF CDEF:powerdNoUnk=power,UN,0,powerd,IF AREA:powerdNoUnk#00ffd0 \
        LINE:power#080
This seems a bit unweildy, but it’s fairly straight forward. The options tell rrdtool to create
a graph with a canvas size of 800x500 pixels, a lower limit of 20W, upper limit of 2kW, and a
log scale. The first CDEF divides our raw value (which was in millwatts) by 1000 to get a value
in watts. rrdtool uses reverse polish notation like some calculators, so you provide the arguments
before the operator.
The big block of CDEF/CDEF/AREA parameters creates a series of area plots in different colours
according to the power level. They’re in descending order so the smaller areas are drawn on top of
the larger layers. This results in a graph that looks like this:

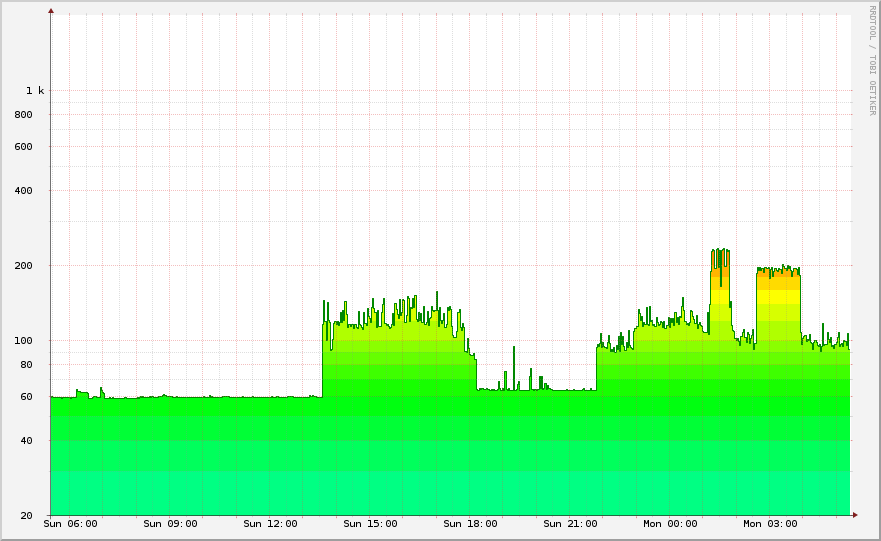
Graph of power usage over a day
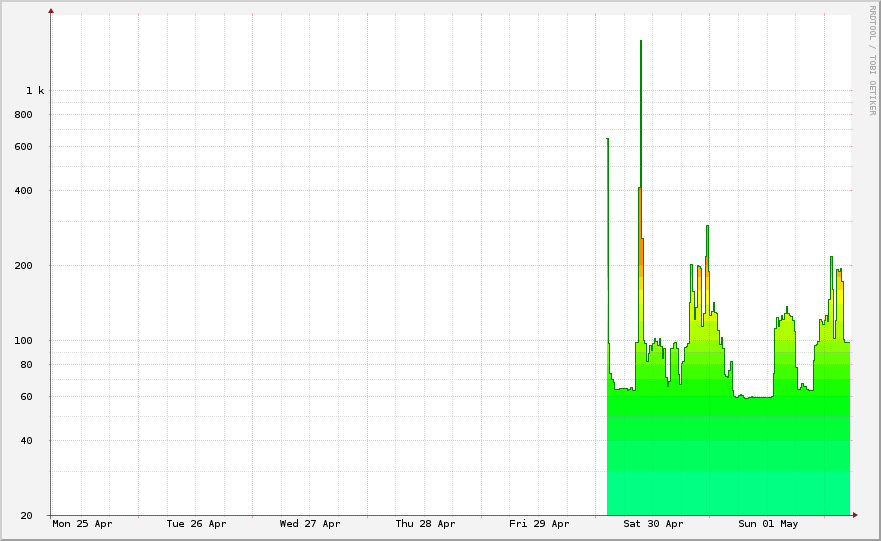
This graph shows the total power for all the things plugged in at my desk. You can see the idle power draw is around 60W. When I’m using the computer it jumps up to around 130W, and when the computer is under heavy load (playing games, for example) it goes up even further to the 200W mark. With a couple of small tweaks to the rrdtool command, I also have a graph showing the entire week:

Graph of power usage over a week
The two huge spikes near the start of the data are caused by a heater under my desk. They’re also one of the main reasons I chose to plot the graphs with a logarithmic scale. With a linear scale between 20W and 2kW, the graph would be completely dominated by these large spikes — in fact the difference in height between the two spikes would take almost half the graph! The relative difference between the normal values of 60-200W and the heater’s value of 1.8kW isn’t actually that interesting, and certainly not worth using about 80% of the graph to demonstrate. The log scale helps to compress this, and emphasises the difference in the smaller values more.
Related posts

Reverse engineering the Sense API
Sense is a little device that sits by your bedside and, in conjunction with a little ‘pill’ attached to your pillow, monitors your sleeping patterns and any environmental conditions that might hamper them. Android and iOS apps show you your sleep history, and offer suggestions for improvements. Sense was Kickstarted in August 2014, raising over 2.4 million US dollars, and shipped to ba...

Home Automation Without the Megacorps
I first experimented with home automation in 2016, by picking up a Samsung “SmartThings” hub. It was terrible. The UI to configure things was slow and clunky, firmware updates were applied whether you wanted them or not, and everything stopped working if their cloud services stopped. You were also locked into whatever integrations they deigned to support, of course. After that broke fo...

Project log: Filament weight display
One problem I have when 3D printing is that it’s hard to gauge whether there’s enough filament left on a roll to complete a print. Sometimes it’s obvious when the print is small or the roll is full, but often it’s not. If I’m unsure about it, I end up obsessing over the printer instead of just leaving it to do its thing. The typical approach to this problem is to use ...
{% figure "left" "A WeMo Insight Switch" %} I recently picked up a couple of <a href="http://www.belkin.com/uk/p/P-F7C029/">Belkin's WeMo Insight Switches</a> to monitor power usage for my PC and ...